|
Using mapsWhy do historians use maps?
It is this variety that makes them so useful to historians. By looking at a map from a particular date, historians can find out a lot of information about the way in which the land was used and, therefore, how people lived. Moreover, by comparing similar maps from different periods historians can discover how an area has changed and developed and suggest reasons for the change. 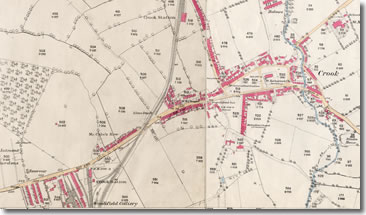 Extract from the 1st edition of the Ordnance Survey of Durham, 1857. (Image courtesy of Durham County Record Office, ref county grid 33.4) Local maps and their uses If you’re ready to continue, you can choose to go to either the Ordnance Survey maps or the coalfield map.  Map of County Durham by John Carey, 1801. (Image courtesy of Durham University Library, XL 912.4281). What are Ordnance Survey maps? Maps, like many other sources of information, are quickly out of date and Ordnance Survey continually resurveys the country to make sure its maps are accurate. This is great news for historians who are able to use the maps to compare how places have changed over time. What can we learn from Ordnance Survey maps? 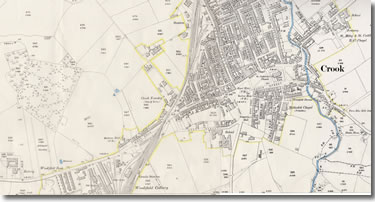 Extract from the 2nd edition of the Ordnance Survey map for the County of Durham showing Crook and part of the surrounding area, 1897. (Image courtesy of Durham County Record Office, ref county grid 33.4.) Click on image to enlarge.  Extract from the 1st edition of the Ordnance Survey map for the County of Durham showing Crook and part of the surrounding area, 1857. (Image courtesy of Durham County Record Office, ref county grid 33.4.)Click on image to enlarge. Take a close look at both extracts from the Ordnance Survey map of Durham. They show the development of Crook over a period of 40 years. Now try to answer the following questions. 1. Compare the two versions of the maps (you will probably need to look at the enlarged versions). Make at least three general statements about the differences between the two. You might want to mention things like housing, number of streets, etc. 2. Now look at the enlarged version of the 1st edition map. Make a list of the facilities (eg schools, churches, pubs etc) in Crook. Then look at the enlarged version of the 2nd edition map and make another list. Write a sentence or two explaining the differences. 3. Based on what you discovered from using the maps and the Census returns, suggest reasons why Crook has changed so much in forty years. Once you have finished, see what else you can find out by looking at a coalfield map. What can we learn from this coalfield map? 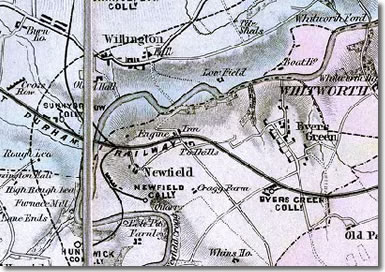 Extract from Bell’s map of the Great Northern coalfield showing the area around Willington. This map will need to be enlarged. This can be done by clicking on the image (warning – large file 6.4mb) or it can be accessed via this link (recommended). (Image courtesy of Durham University Library ref XL 553.2.) Take a close look at the coalfield map before answering the following questions.You will need to use the enlarged version. This can either be downloaded by clicking on the image(warning – very large file 6.4mb) or you can look at it via this link (recommended). 1. Find Crook on the map and make a list of all the nearby collieries. 2. Now find the railways which serve Crook and trace their path. Do you notice any connection between the collieries and the railways? 3. Where do the rail lines end? 4. What does the information in this map tell you about: Once you have finished answering the questions try moving on to the next section – using trade directories. |